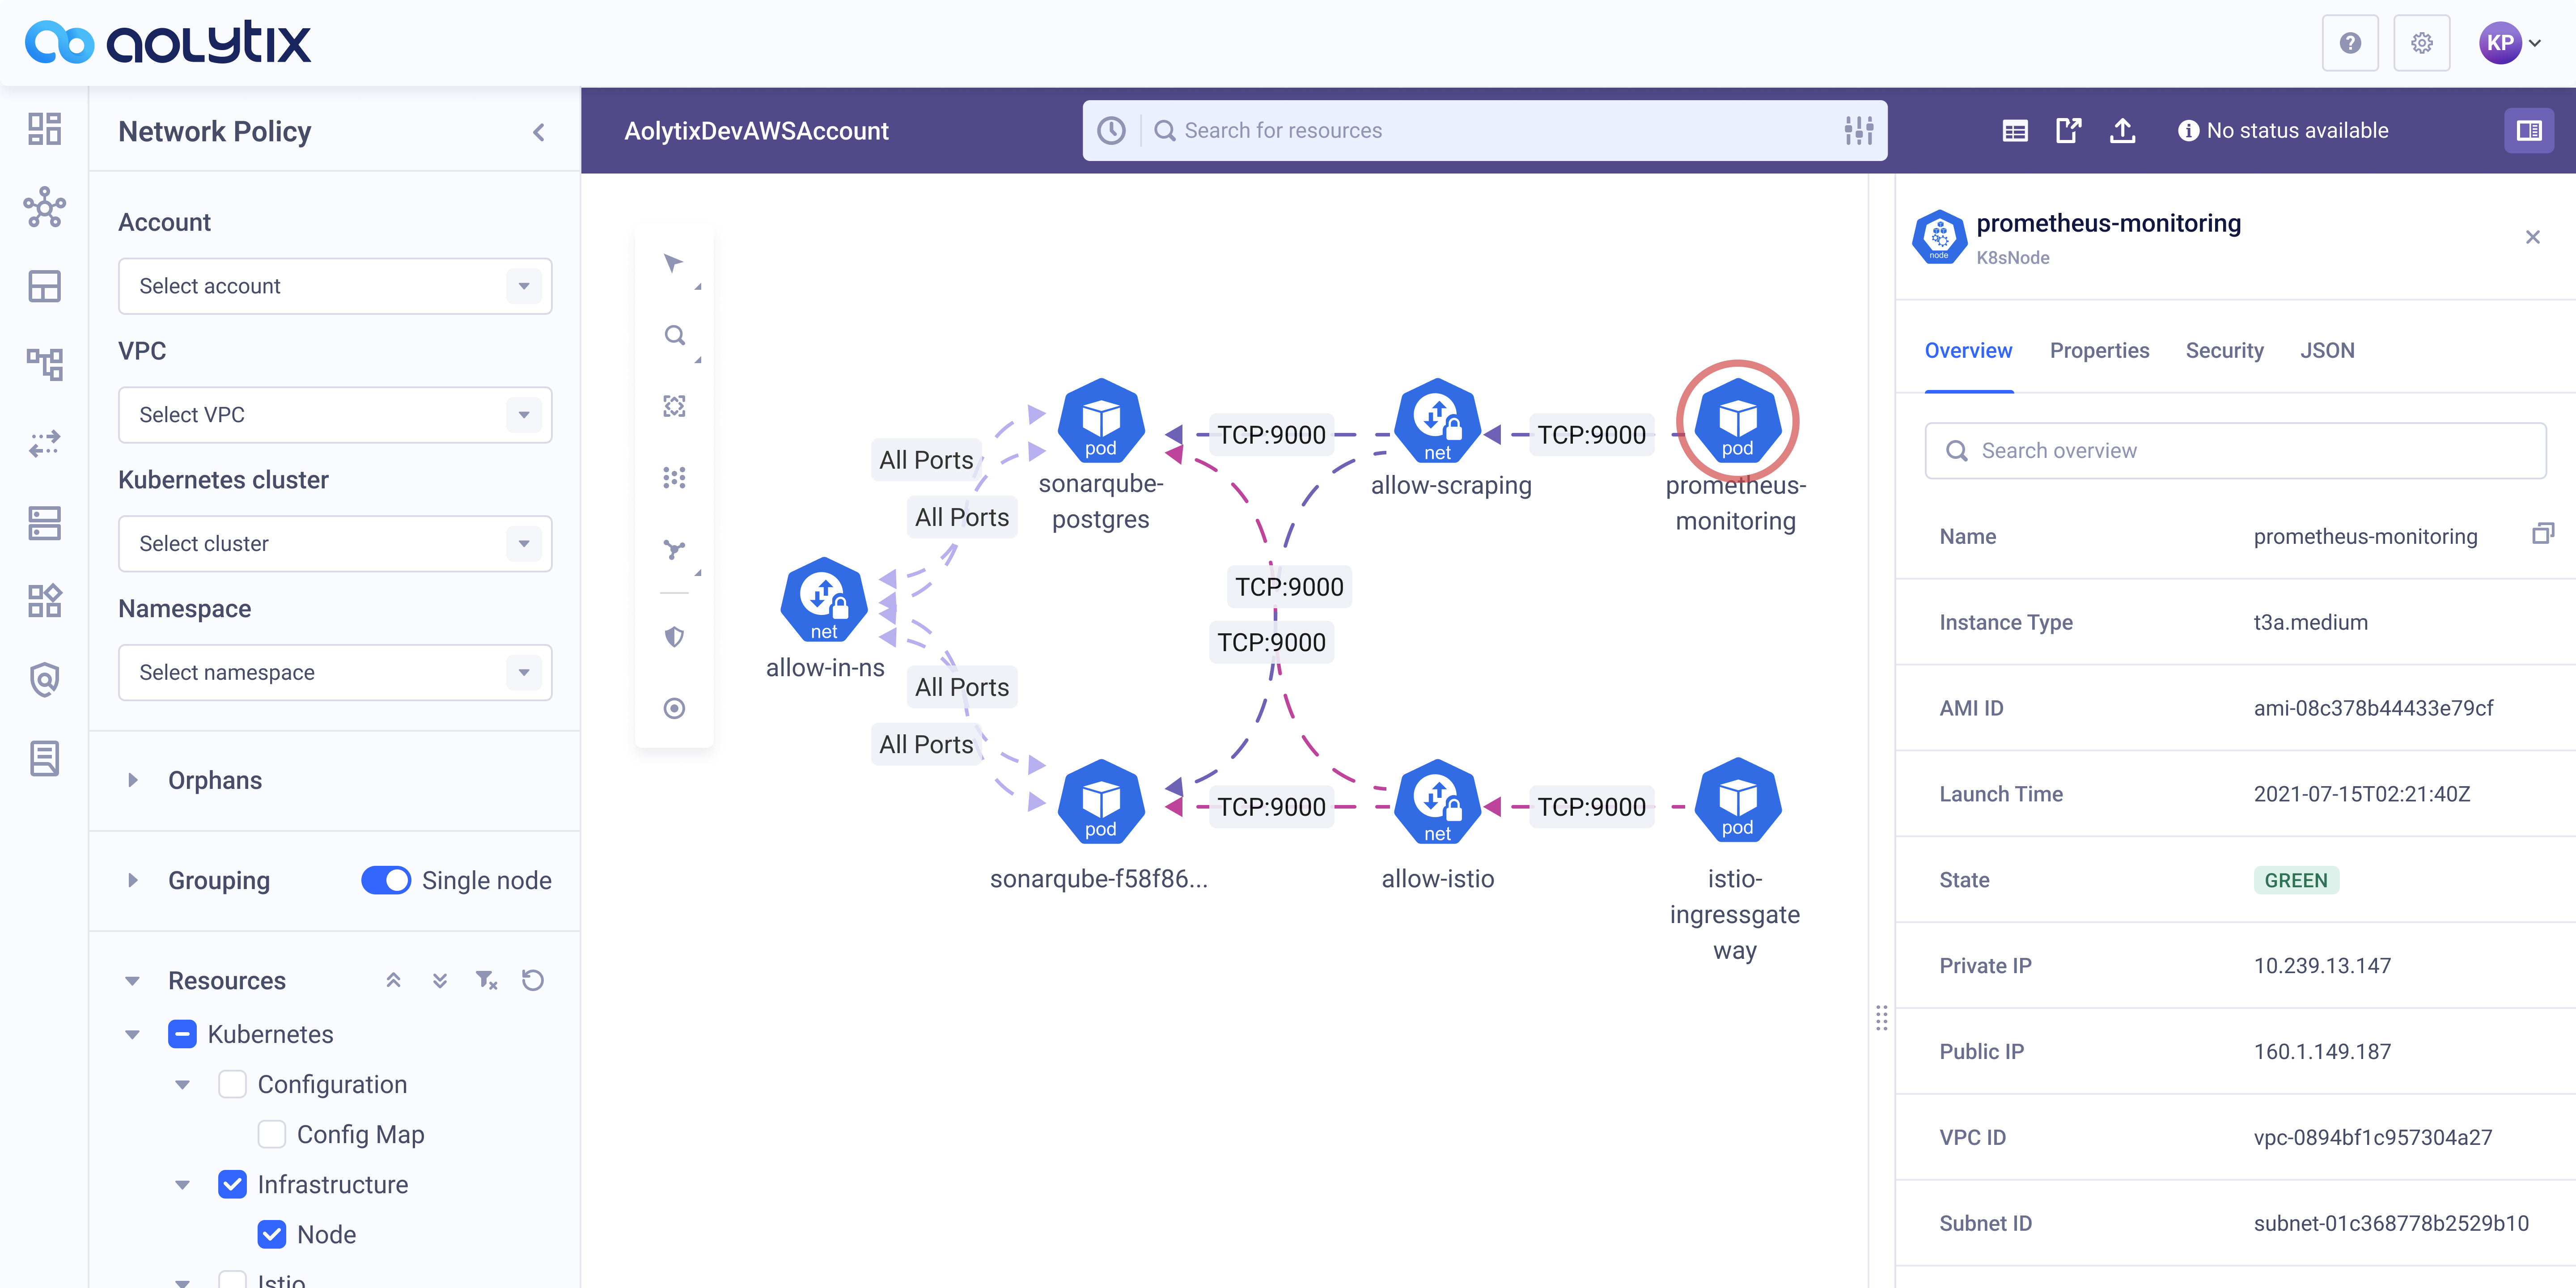
Simplifying Cloud Complexity with Intuitive Visualization
aolytix.io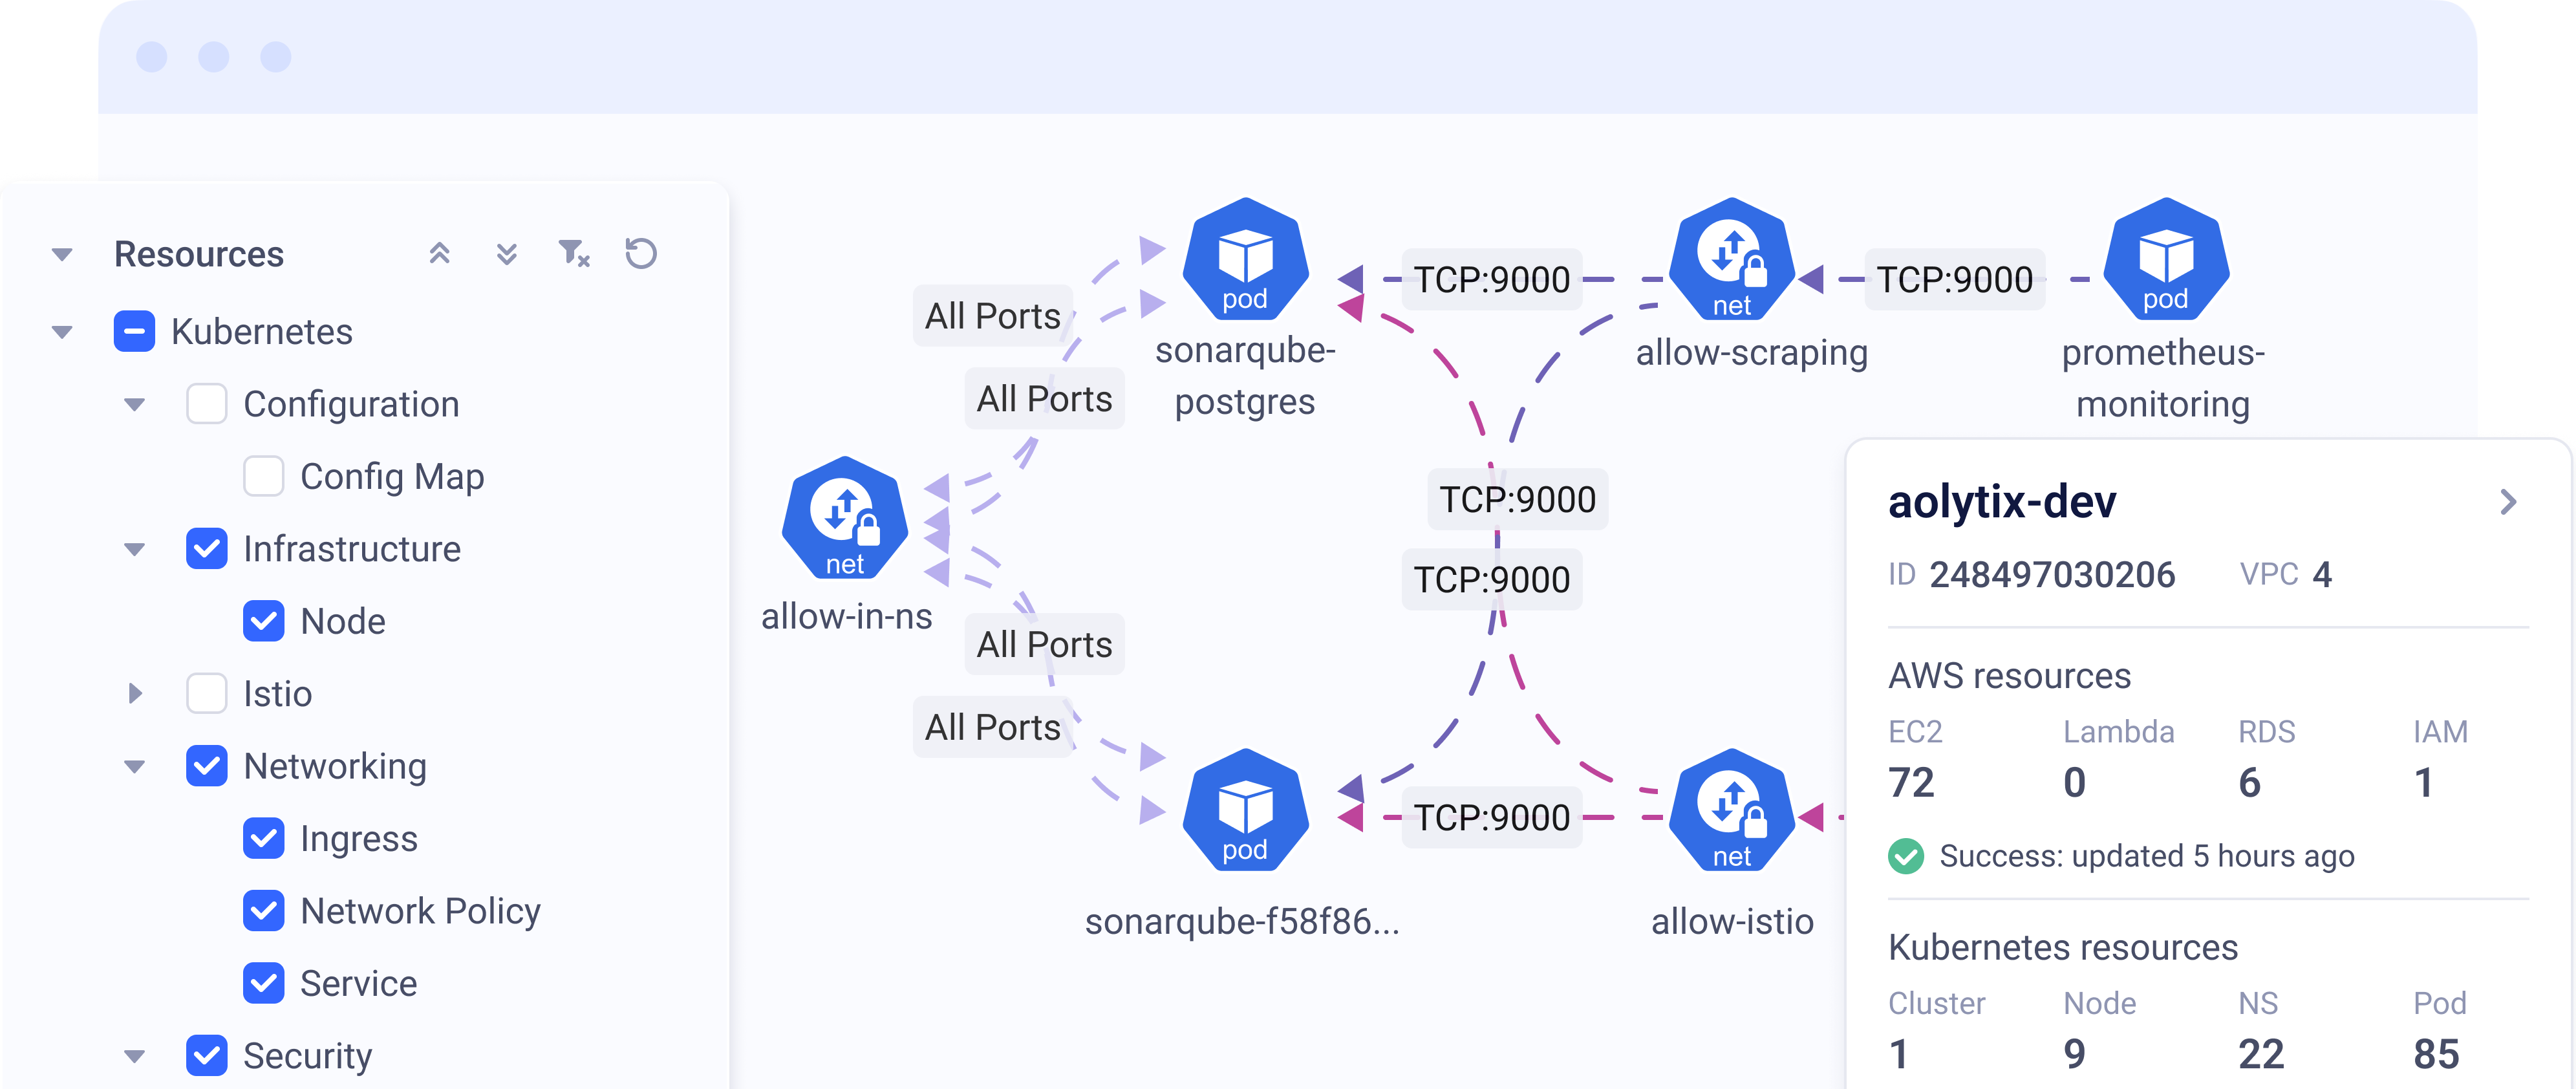
Overview
As the lead product designer, I drove the design of Aolytix, a cloud infrastructure visualization tool. I helped shape the product vision, made user-focused design calls, and worked closely with engineers and stakeholders to create a solution that makes complex cloud environments easier to understand while boosting security compliance.
The Problem
Modern cloud setups are getting more complex, and misconfigurations can lead to outages, security breaches, and compliance headaches. We saw a real need for better visibility and understanding.
UX Research
UX Design
UI Design
Visual Design
Brand Design
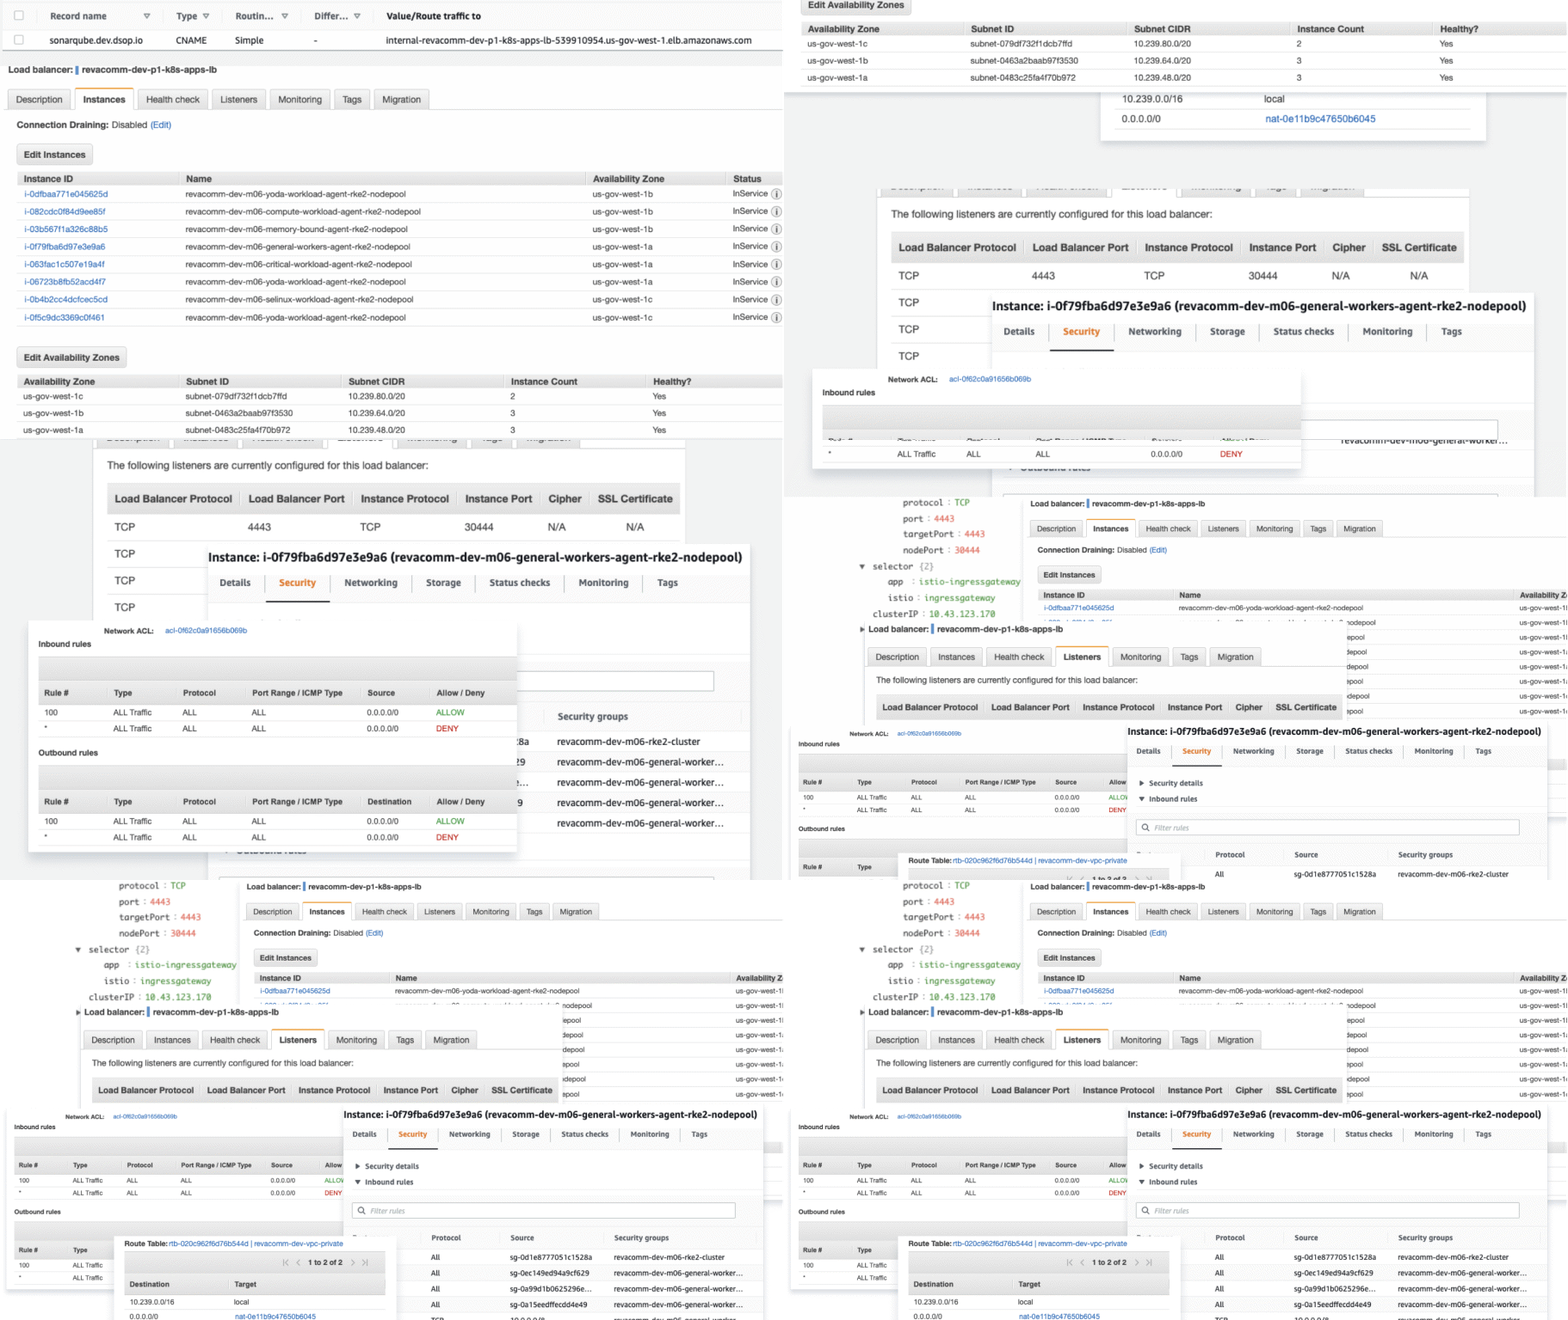
A typical view of cloud infrastructure management today: scattered information across multiple screens and tabs. Engineers need to piece together load balancer configurations, security rules, and network settings just to understand how systems are connected.
Discovery & Research
Through interviews with cloud engineers, security specialists, and IT managers, one issue kept coming up—visualizing cloud infrastructure was a mess. It made spotting security risks, misconfigurations, and inefficiencies way harder than it should be.
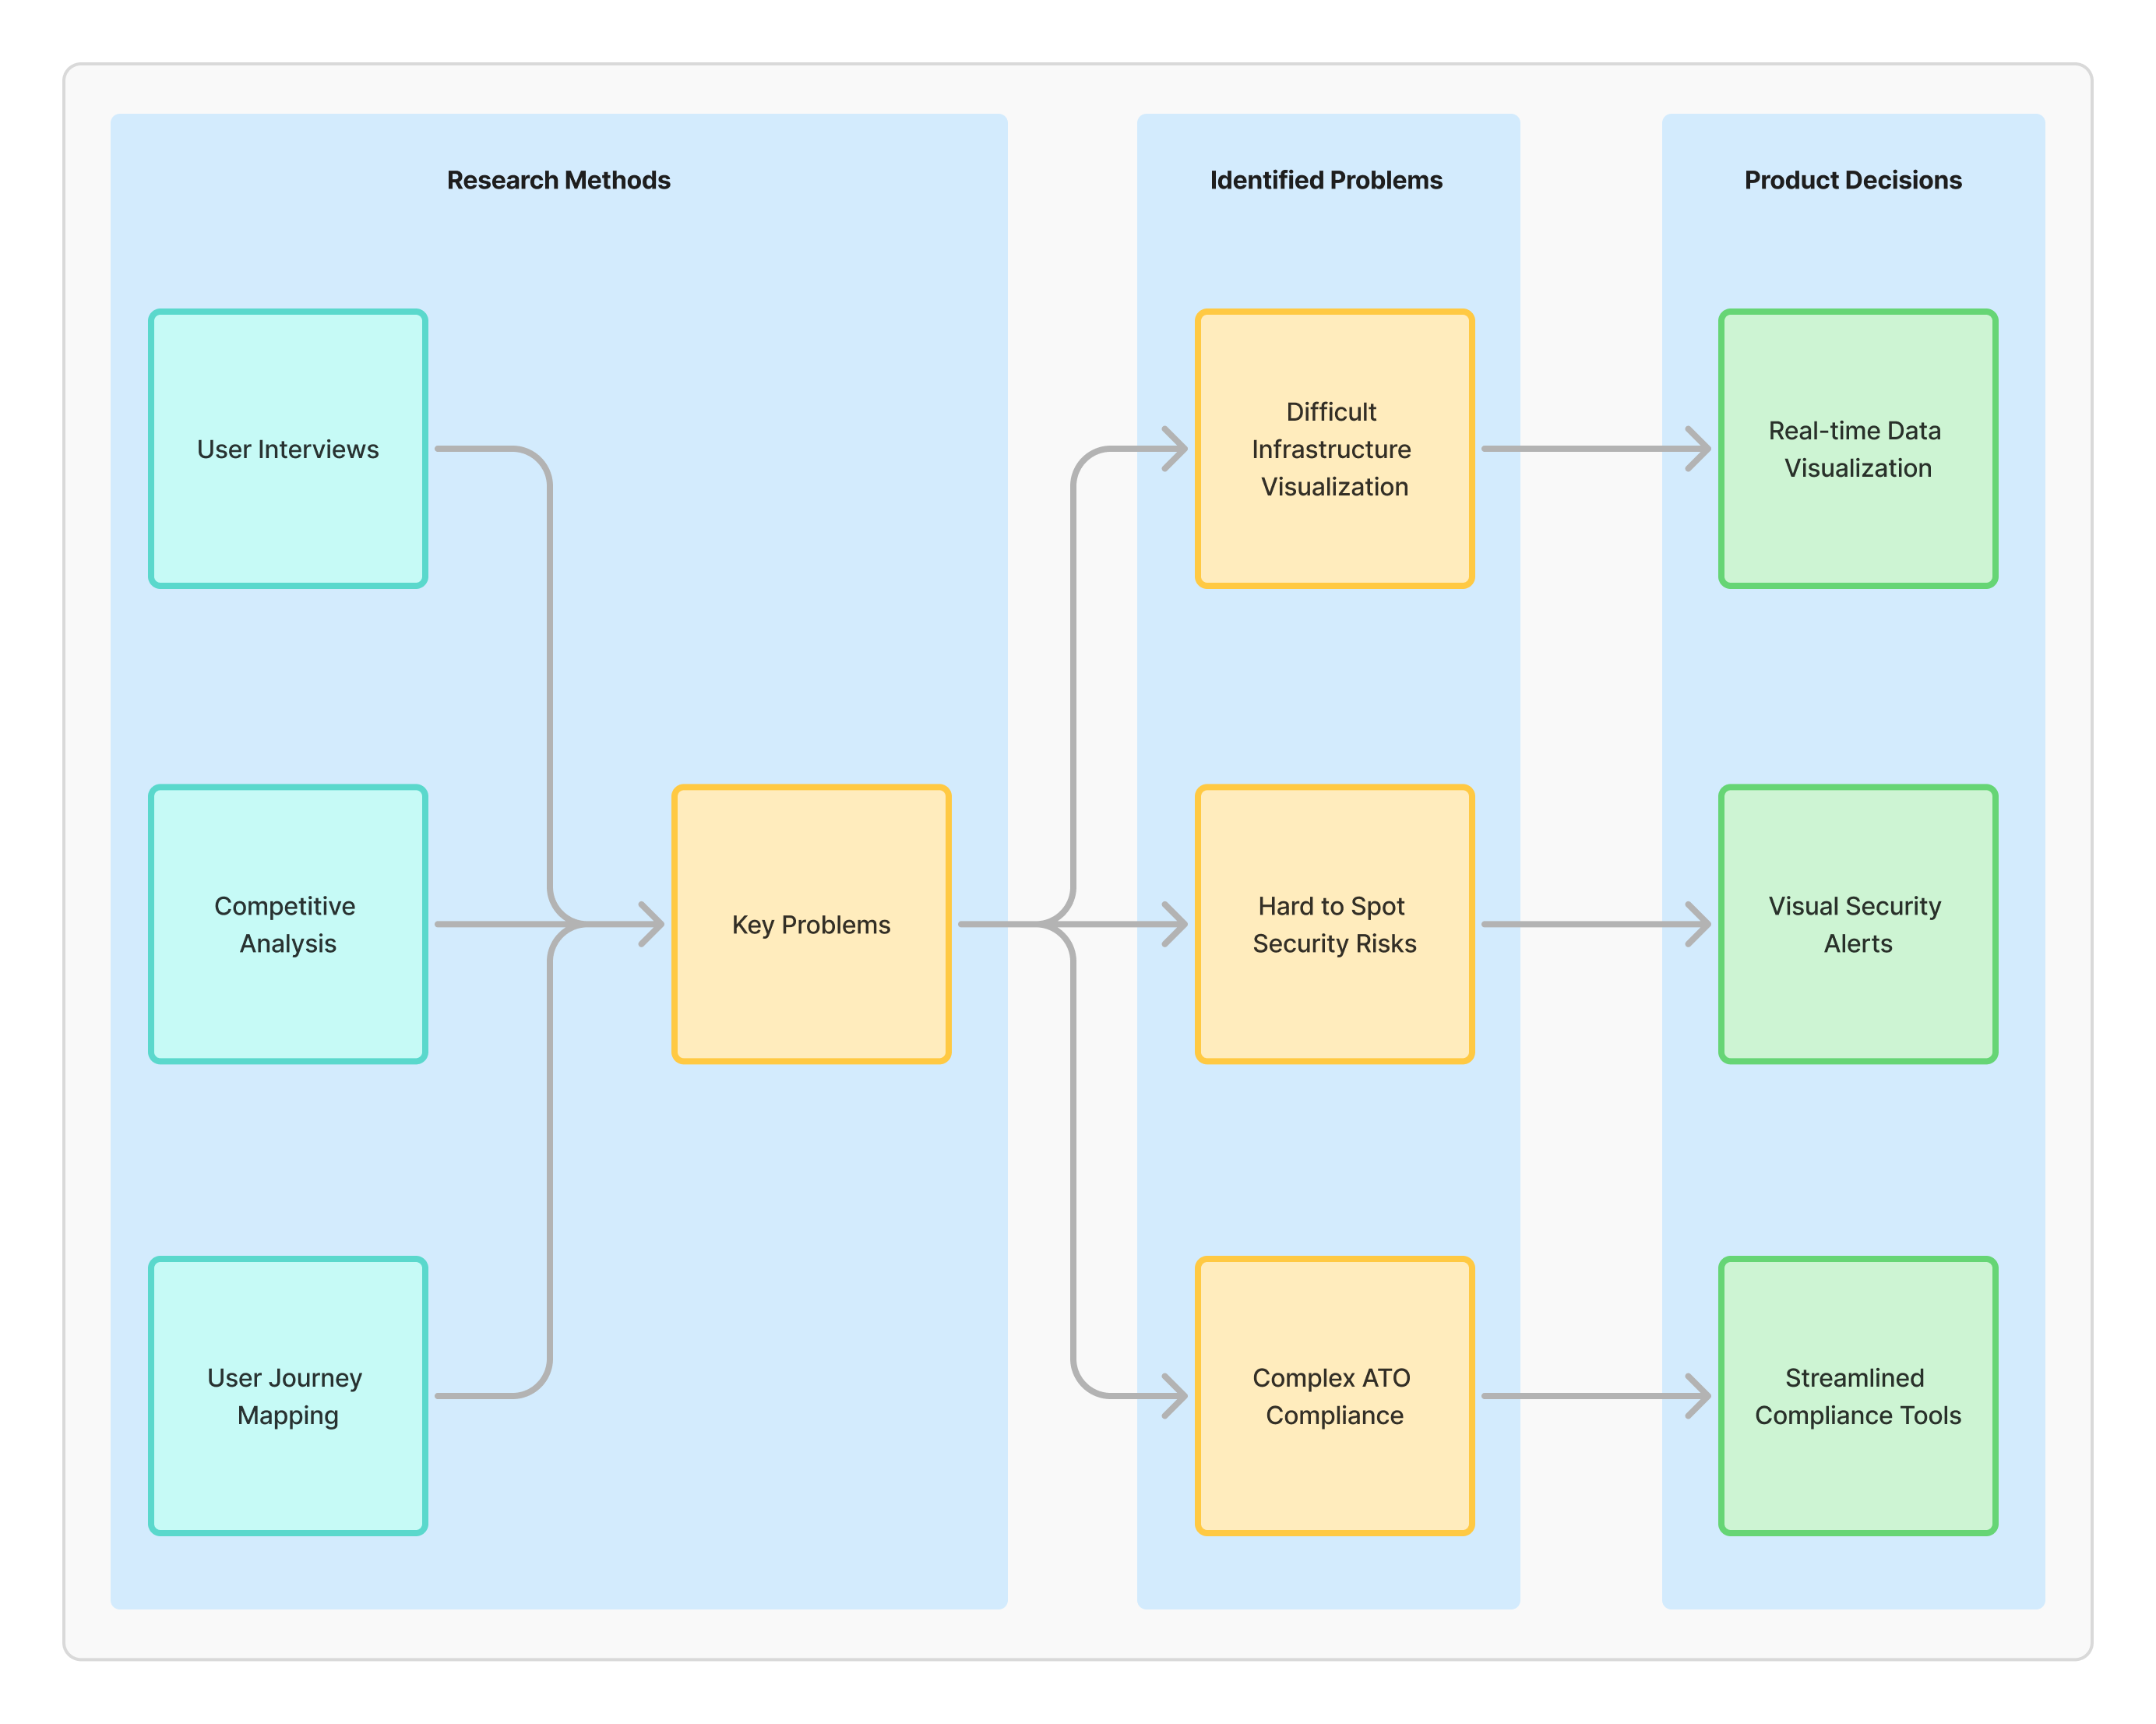
Our research approach combined several methods that revealed important insights:
Stakeholder Interviews: Showed that teams spent a lot of their time switching between tools
Competitive Analysis: Revealed gaps in visualization capabilities among existing tools
User Journey Mapping: Identified critical bottlenecks in security investigation workflows
Pain Point Analysis: Highlighted consistent frustrations with tool fragmentation
Our research identified three distinct user types, each with unique needs:
Security Specialists: Need quick threat detection and clear compliance tracking
DevOps Engineers: Focus on efficient resource management and deployment monitoring
Infrastructure Managers: Require high-level oversight and cost optimization tools

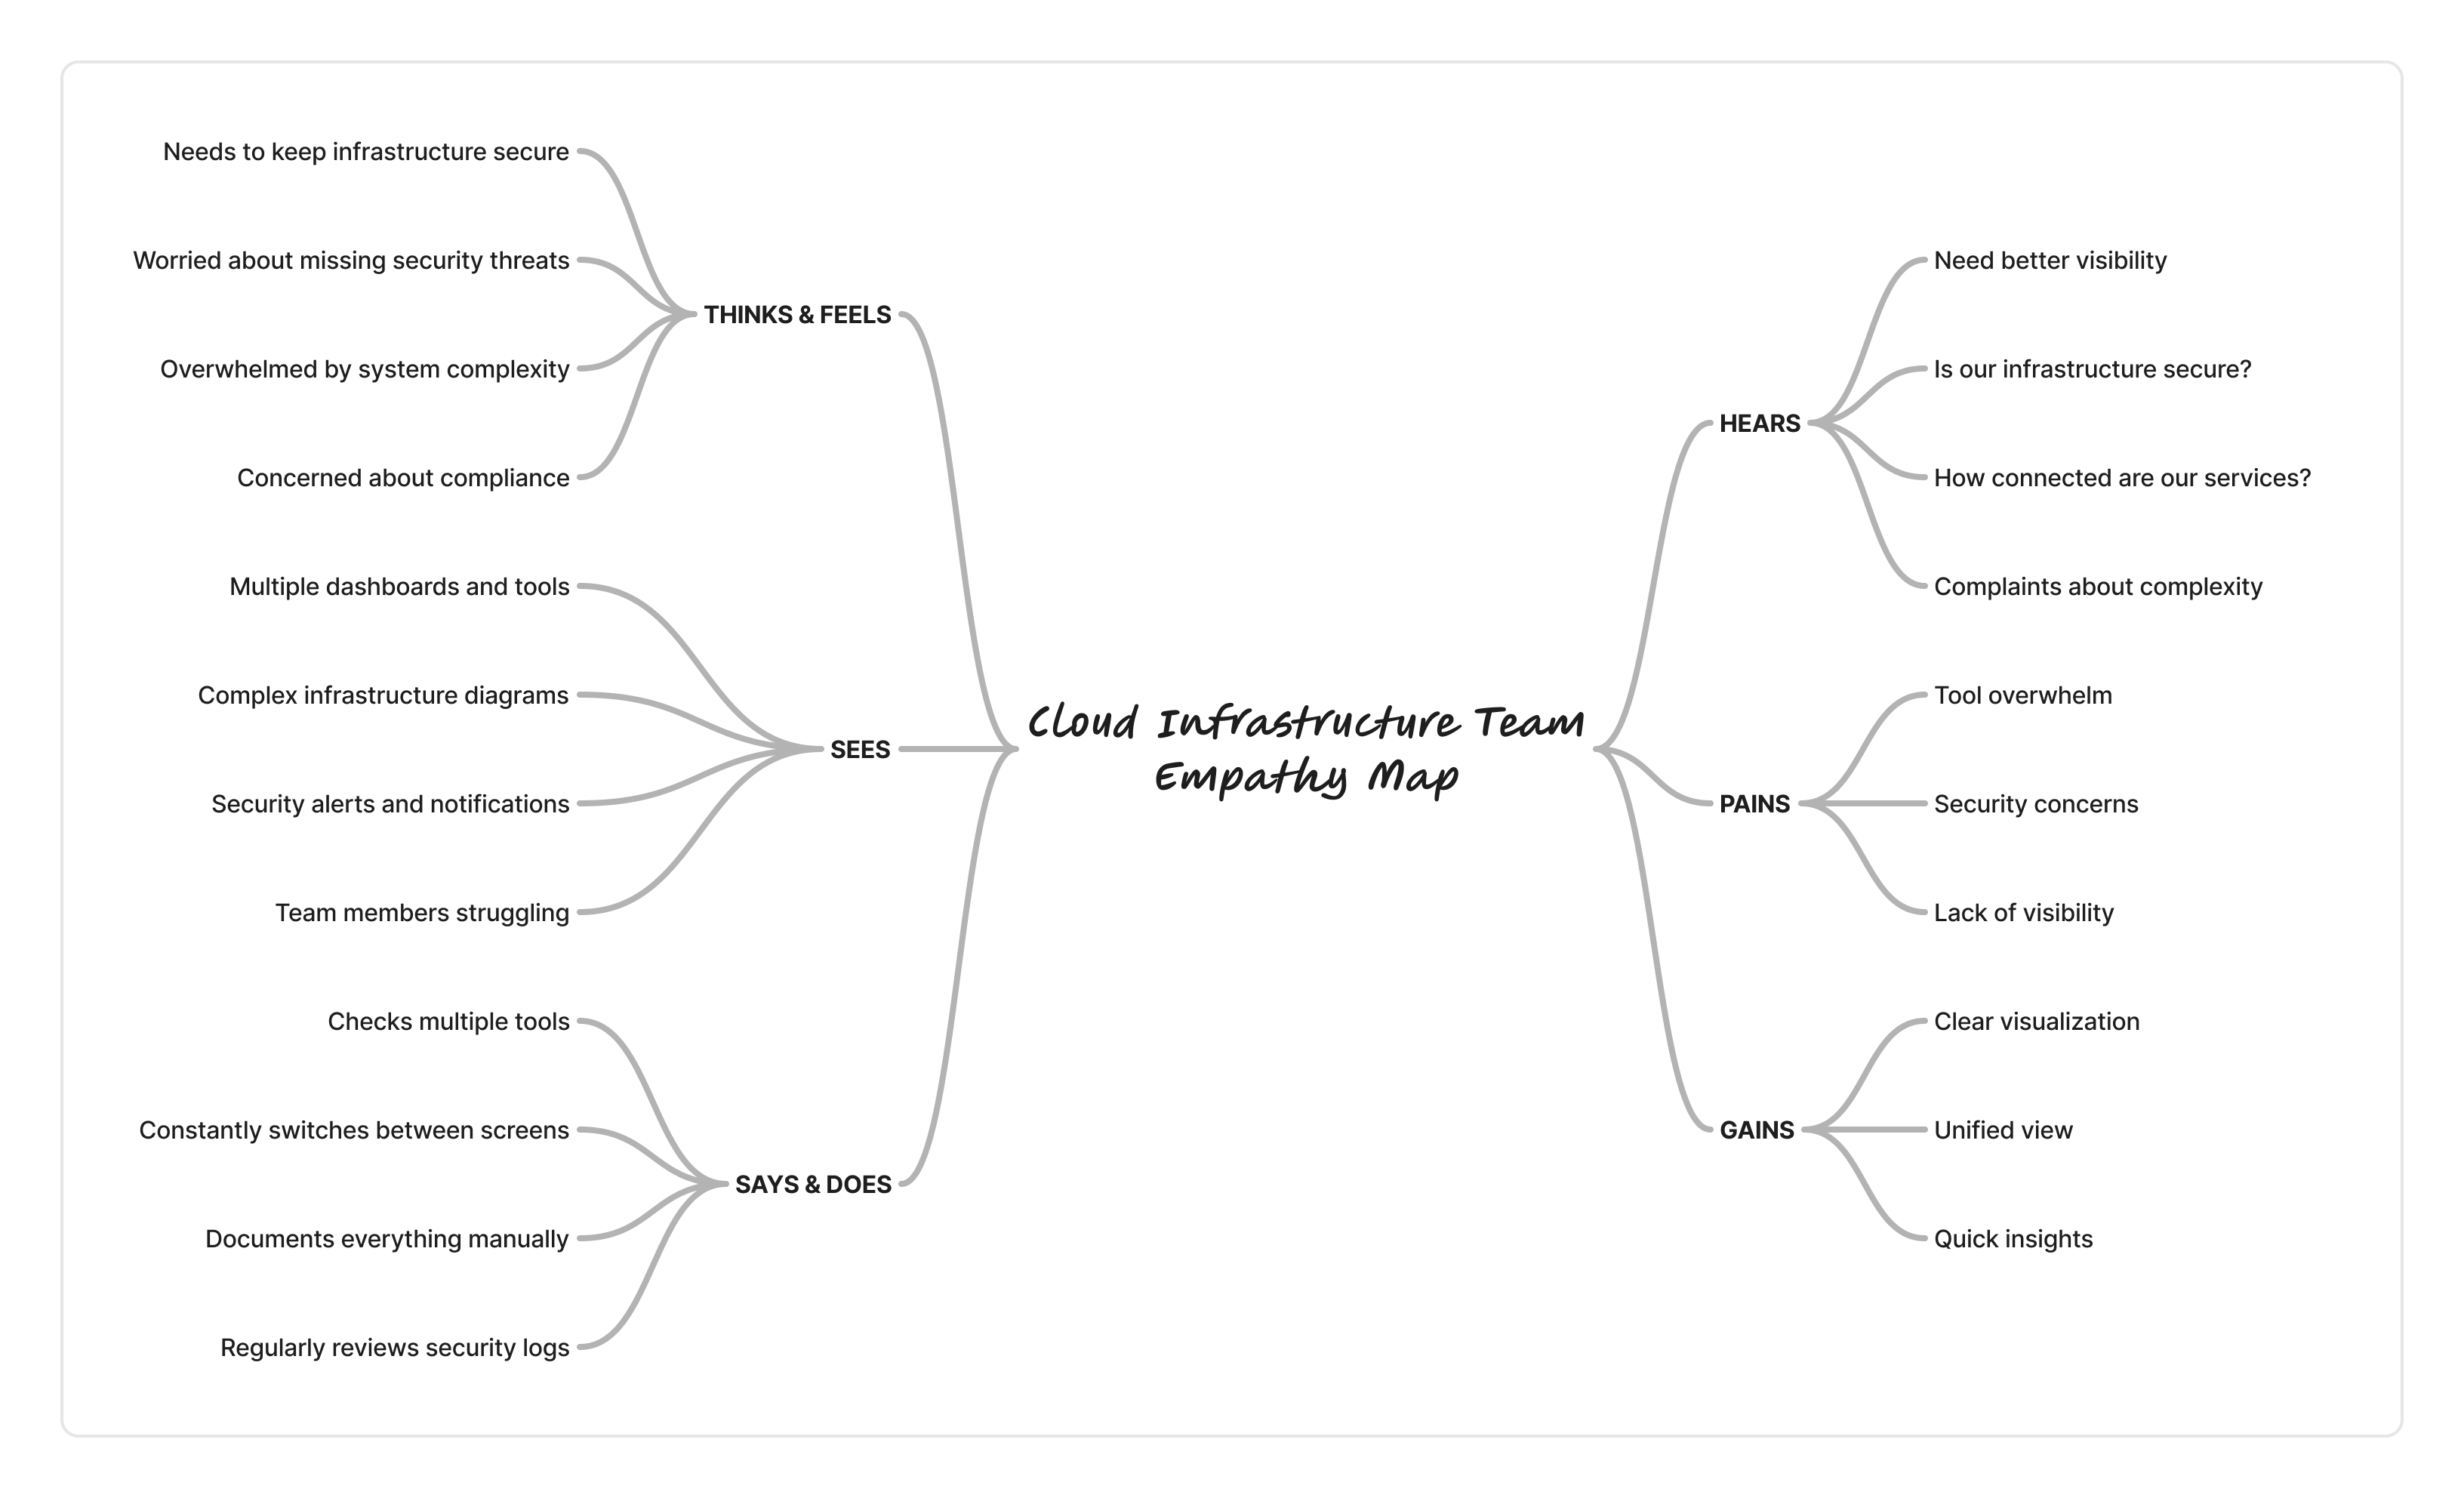
Key insights from our empathy mapping showed users were:
Overwhelmed by multiple tools
Concerned about missing security threats
Frustrated by lack of visibility
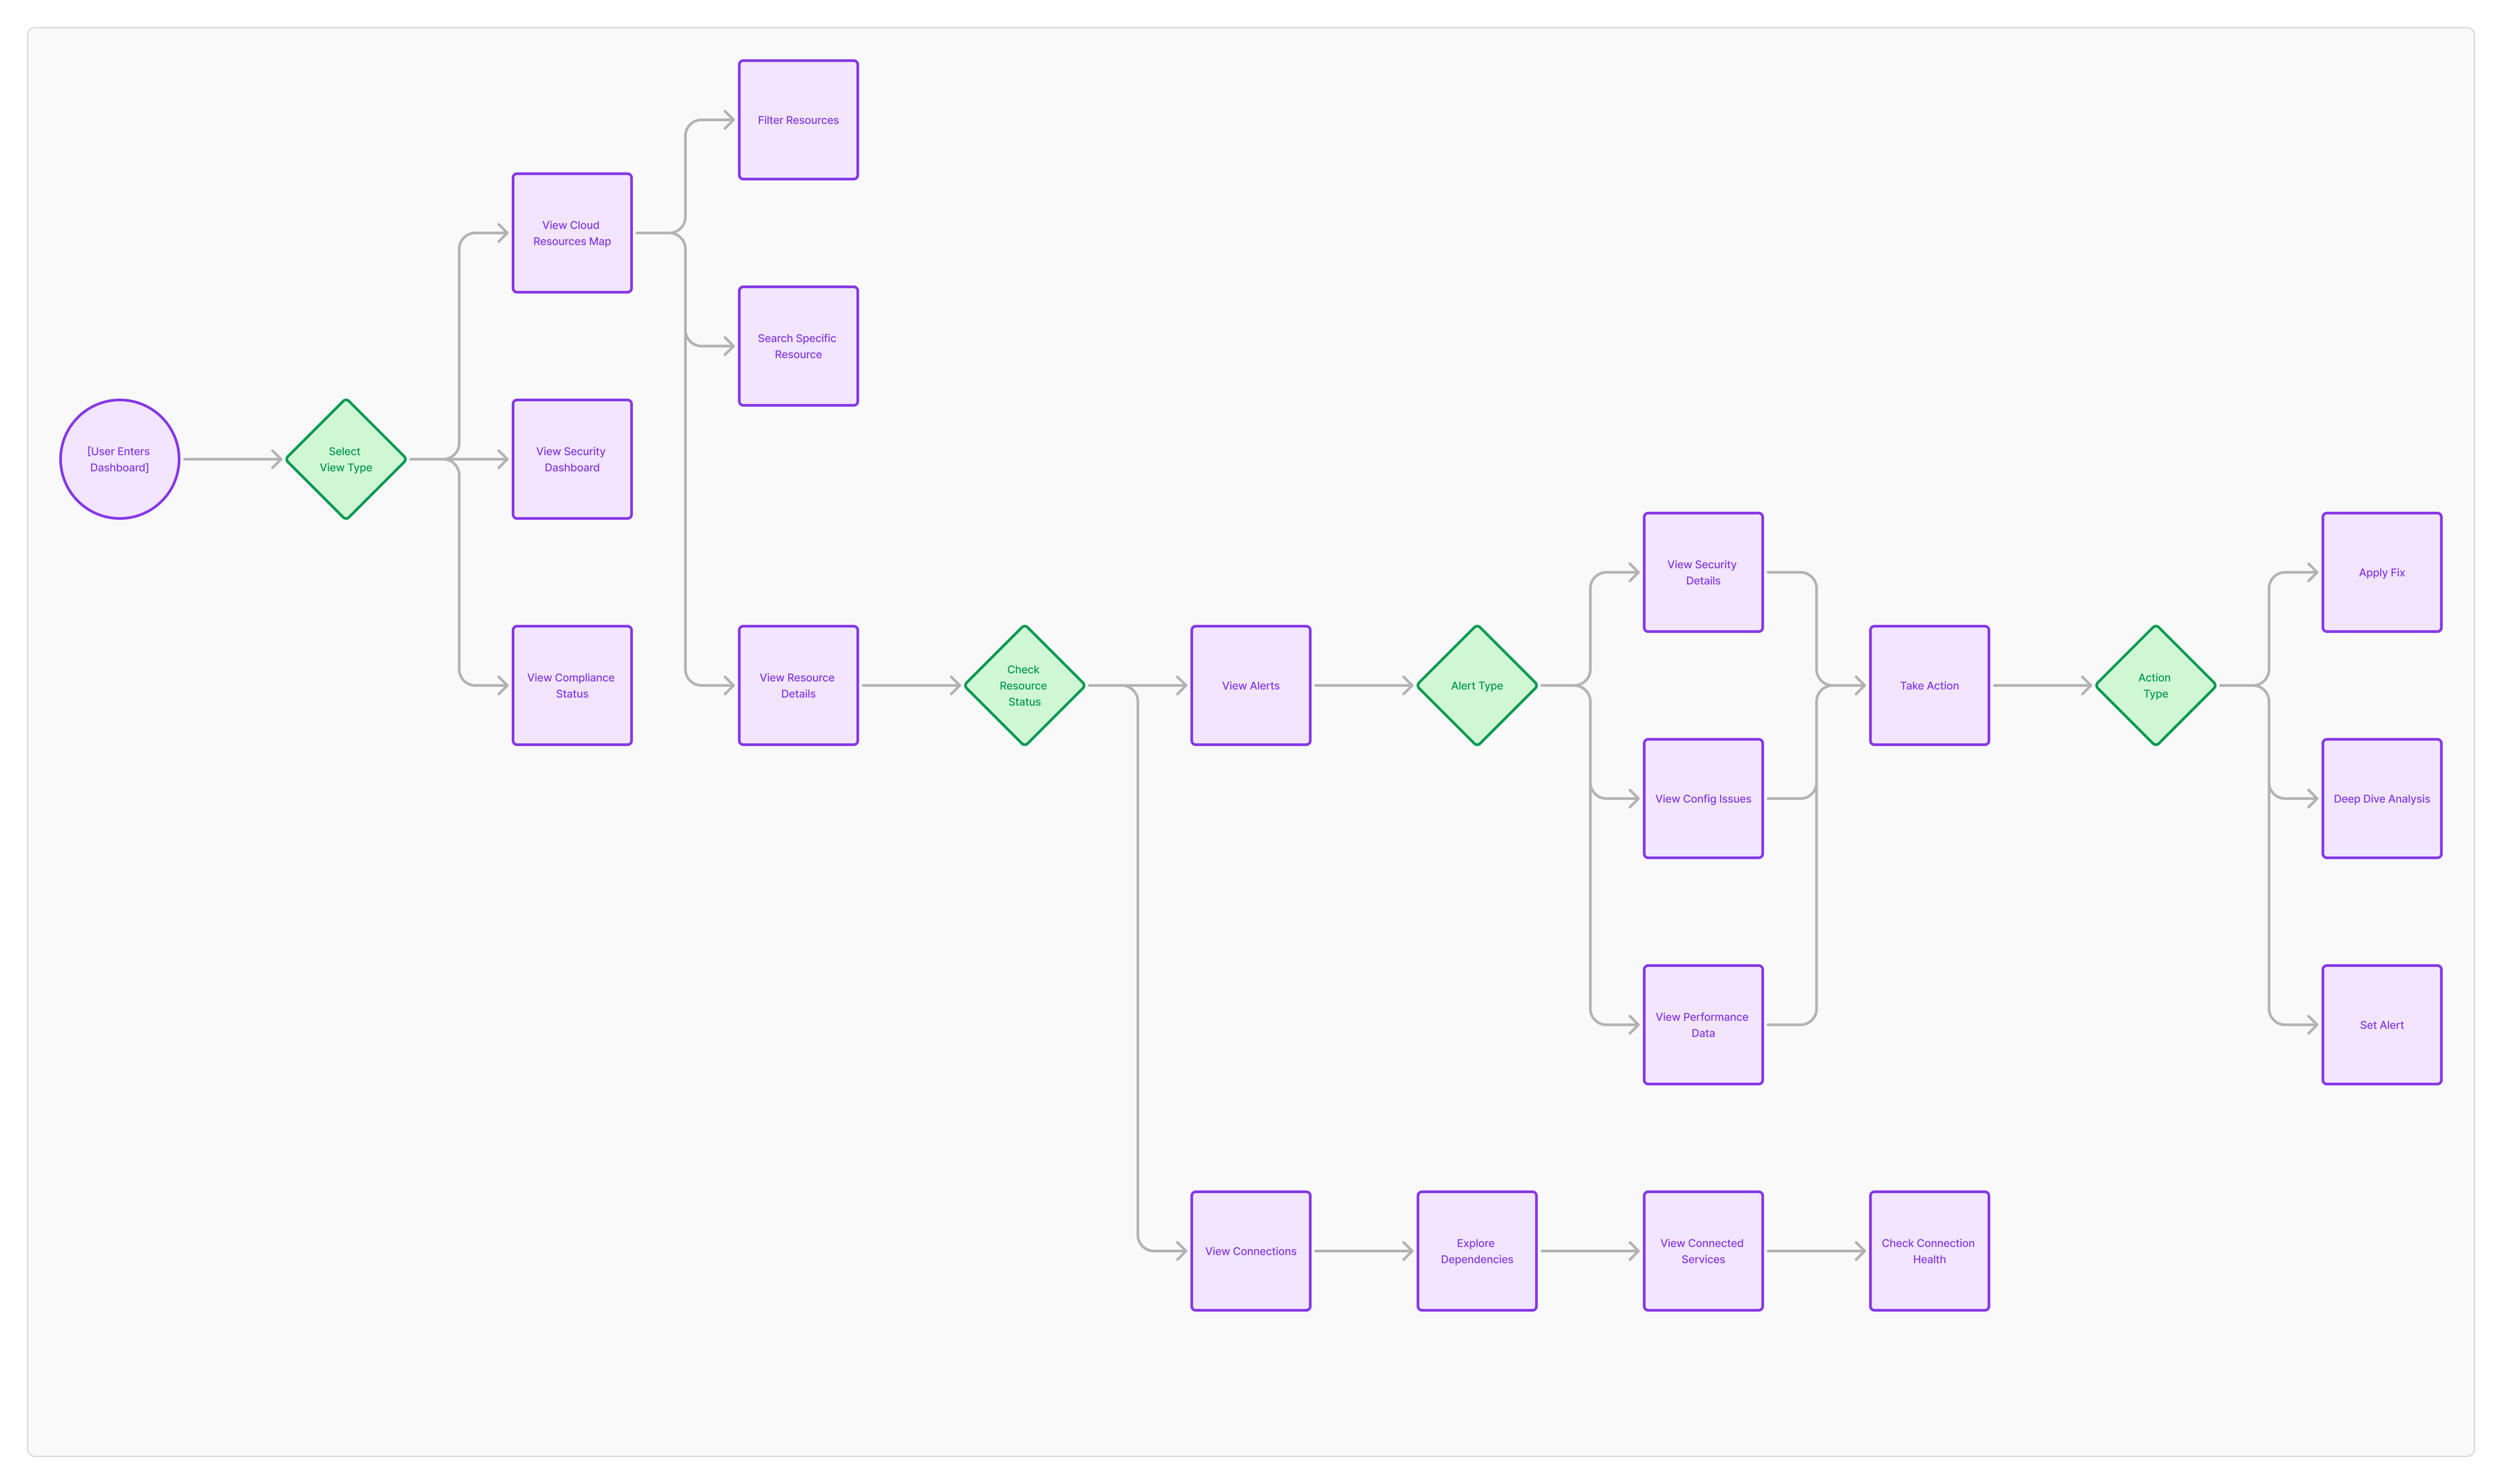
The journey map revealed critical pain points in the security investigation process:
Multiple tool switches cause delays
Manual processes slow response time
Documentation is time-consuming
Solution Design
Our approach focused on turning complex cloud infrastructure into clear, actionable visualizations. We developed four core design principles that guided our decisions.
Simplify Complexity

Break down complex systems
Clear visual hierarchies
Progressive disclosure
Visualize Relationships

Show clear connections
Highlight dependencies
Map resource flows
Enable Quick Action

Context-aware actions
Reduce steps needed
Surface relevant info
Keep Security Context

Keep security visible
Highlight potential risks
Show compliance status
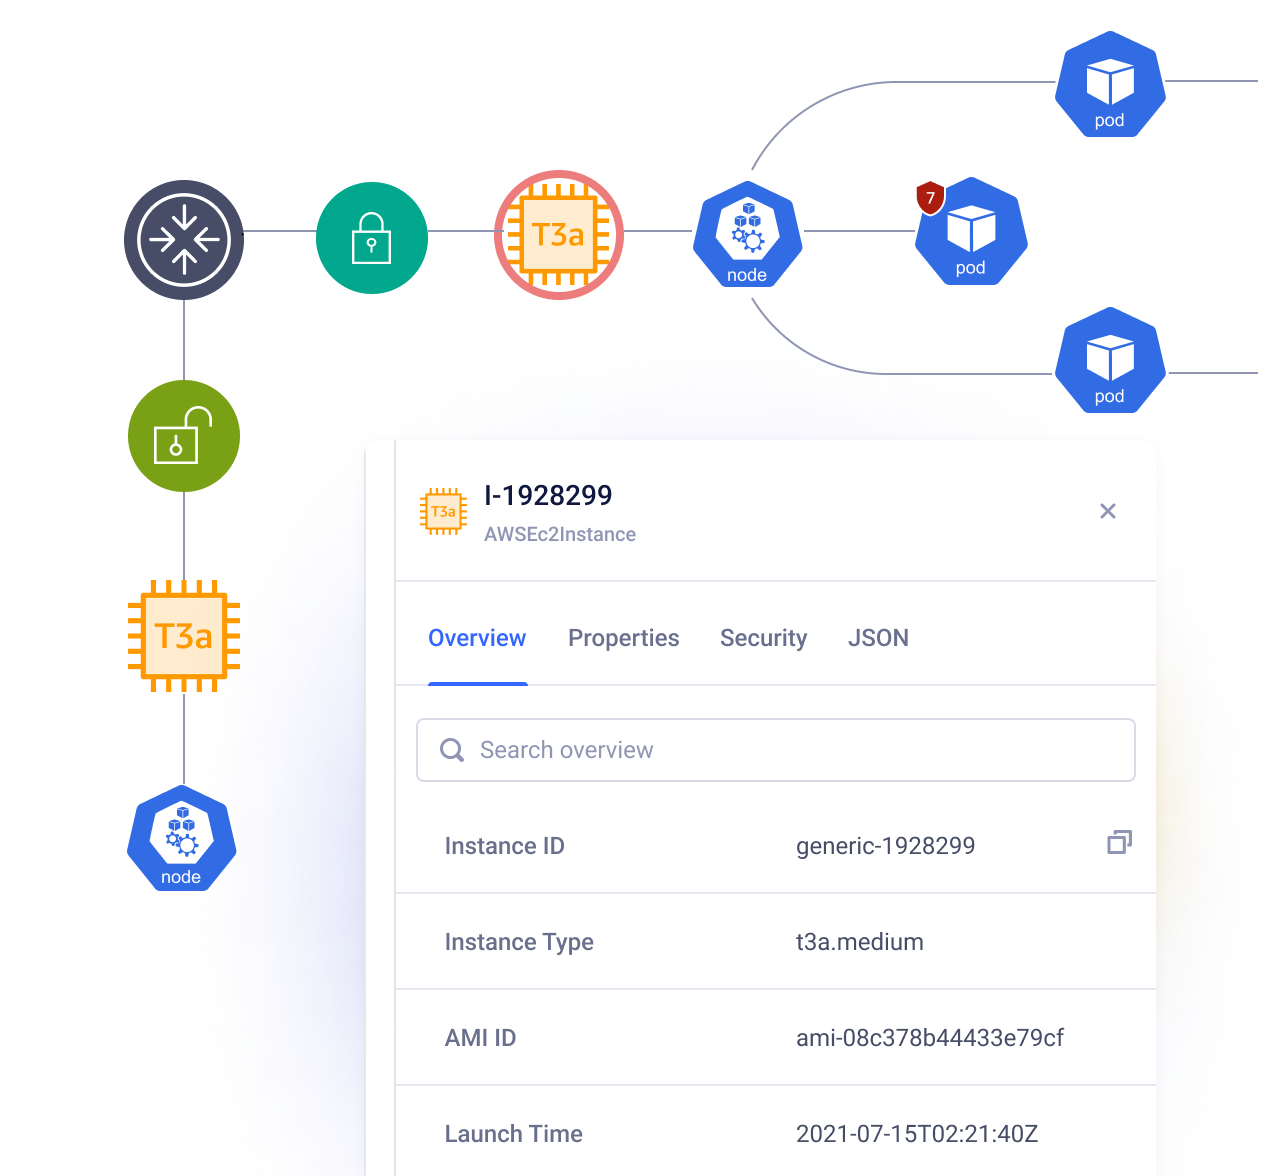
We designed an interactive topology that:
Shows resources and their relationships
Highlights security groups and access rules
Displays real-time health status
Enables quick configuration access


Security teams needed to spot issues quickly and understand their impact. Our solution:
Visualizes security rules and relationships
Shows traffic patterns and potential risks
Highlights misconfigurations
Tracks compliance status
Design System
Our design system was built to handle complex cloud infrastructure while maintaining clarity and usability. By creating a robust component library, we established a consistent visual language that scaled across the entire platform.
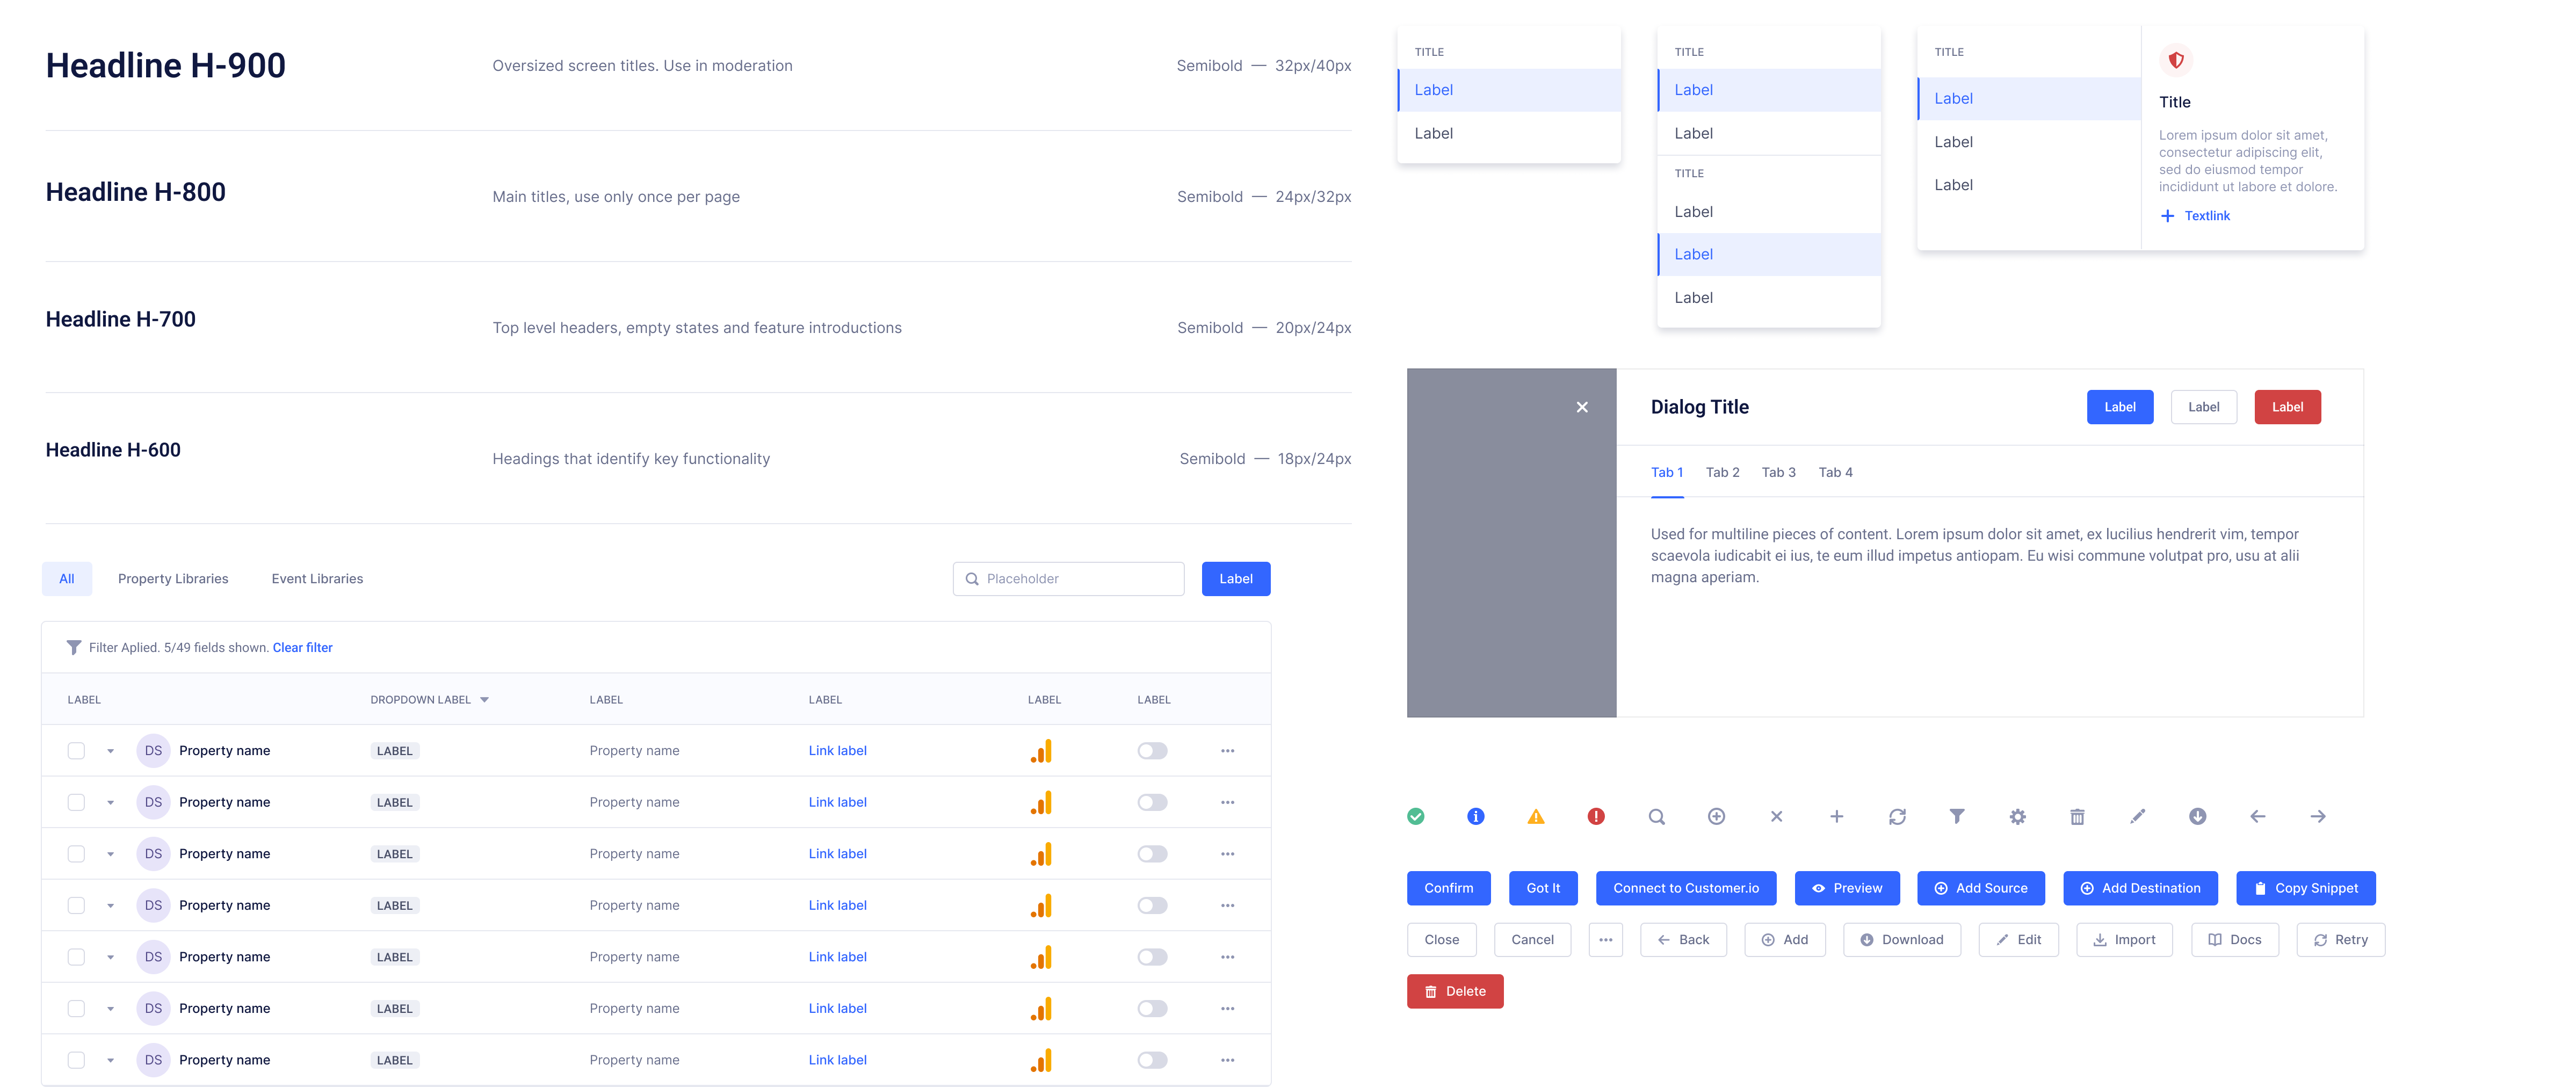
Base Components
Resource cards are the main way users interact with cloud resources. They show key information at a glance – status, IDs, and quick actions.
Connection lines show how resources talk to each other. Different line styles tell you about traffic flow, protocols, and security status without digging through configs.
Status indicators are simple but powerful indicators show health, security, and performance across the app.
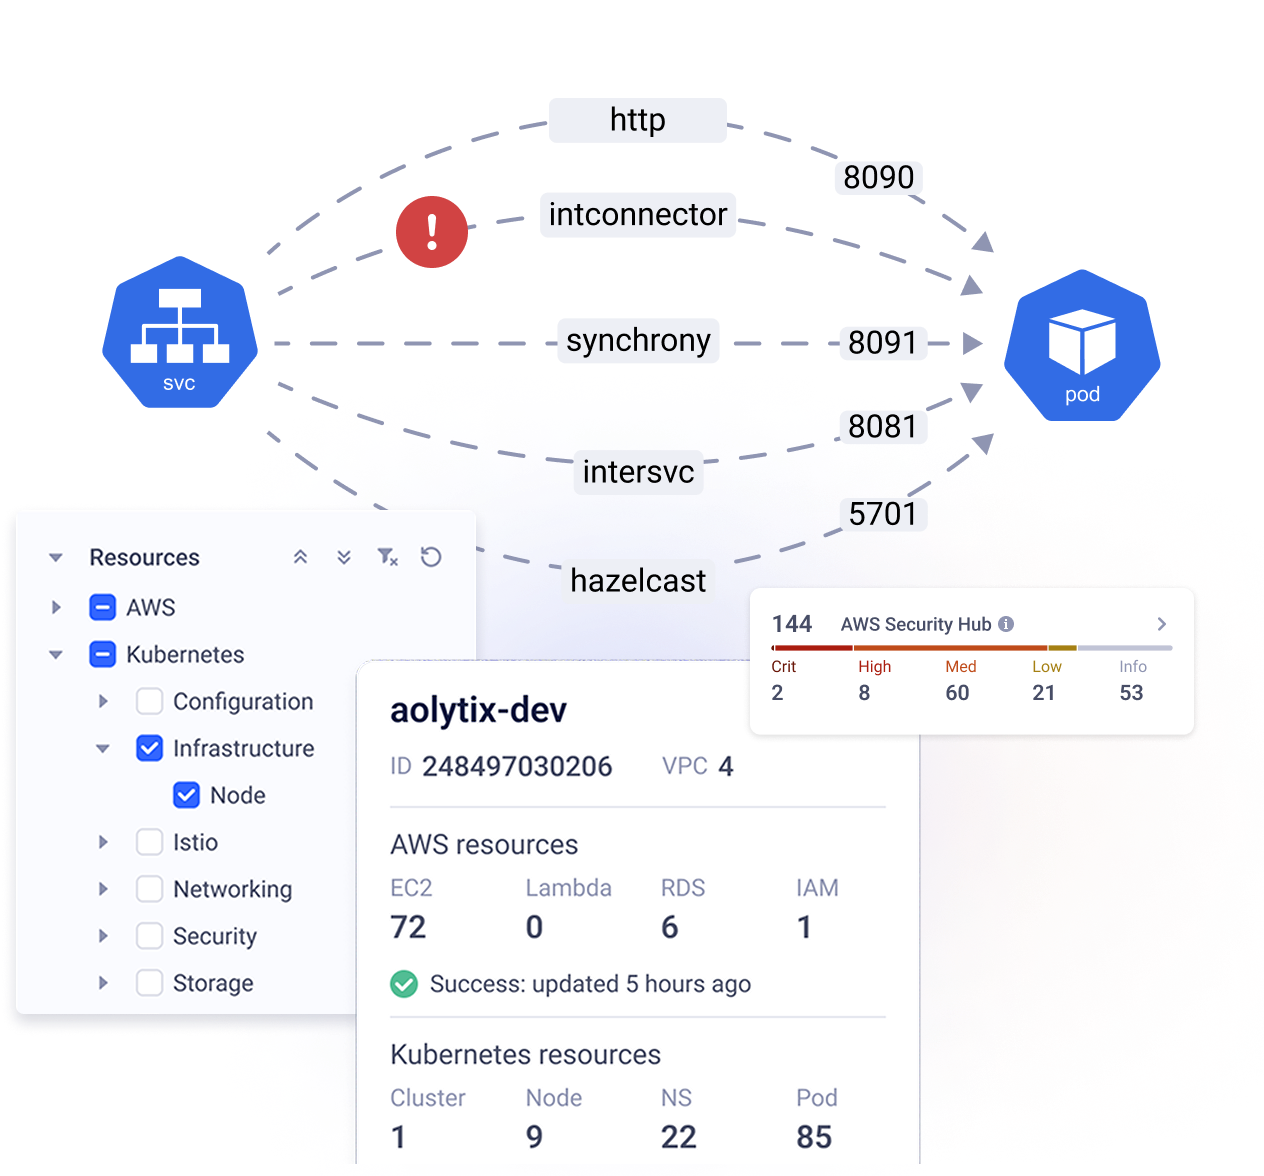
Complex Components
Interactive topology show your cloud setup. They combine lines, and statuses to give you the big picture of your infrastructure.
Property panels are panels for reviewing resource information. Common settings up front, to advanced details one click away.
Alert badges help you spot and fix issues quickly. Each alert includes what’s wrong and how to fix it.
The Solution
Aolytix makes sense of complex cloud infrastructures by turning raw data from AWS, Kubernetes, and other sources into clear, interactive visual graphs. It gives you both a high-level overview of your cloud environment and a detailed map of how resources connect and communicate.
Brand & Marketing
Beyond product design, I led Aolytix's brand and marketing development. Starting with our message "Seeing is Understanding," I created everything from the website to educational videos. The goal was simple: make complex cloud infrastructure easy to grasp through friendly visuals and clear messaging across all our marketing materials.
The Results
Aolytix delivered clear results: teams found security issues faster, solved problems in minutes instead of hours, and simplified their compliance process.

